Hierarchical Clustering of Electrical Sockets
Whenever I need to travel, I always have to remember to check if I have an adaptor for the socket types in the country I am going to.
It is no surprise that there are so many standards. Many countries have multiple socket types, and out of those, some are compatible between them. I was curious to find out how would Hierarchical Clustering, an unsupervised clustering algorithm, group different countries together based on the plug types used. For this purpose, I have built a Shiny application to help me interactively apply clustering.
Input Data
The data used in the application has been downloaded from www.worldstandards.eu on 2017-04-16 and subsequently cleaned and formatted nicely. It can be downloaded here
The schema for the data looks like this:
'data.frame': 197 obs. of  16 variables:
 $ country: chr  "Afghanistan" "Albania" "Algeria" "Andorra" ...
 $ A      : int  0 0 0 0 0 1 0 0 0 0 ...
 $ B      : int  0 0 0 0 0 1 0 0 0 0 ...
 $ C      : int  1 1 1 1 1 0 0 1 0 1 ...
 $ D      : int  0 0 0 0 0 0 0 0 0 0 ...
 $ E      : int  0 0 0 0 0 0 0 0 0 0 ...
 $ F      : int  1 1 1 1 0 0 0 1 0 1 ...
 $ G      : int  0 0 0 0 0 0 0 0 0 0 ...
 $ H      : int  0 0 0 0 0 0 0 0 0 0 ...
 $ I      : int  0 0 0 0 0 0 1 0 1 0 ...
 $ J      : int  0 0 0 0 0 0 0 0 0 0 ...
 $ K      : int  0 0 0 0 0 0 0 0 0 0 ...
 $ L      : int  0 0 0 0 0 0 0 0 0 0 ...
 $ M      : int  0 0 0 0 0 0 0 0 0 0 ...
 $ N      : int  0 0 0 0 0 0 0 0 0 0 ...
 $ O      : int  0 0 0 0 0 0 0 0 0 0 ...
A description of the individual plug types can be found here
Method
To group countries based on the socket types available in each country respectively I have chosen to use Hierarchical Clustering. The individual electrical socket types have been one-hot encoded for each country. This way, I was able to use a numerical feature vector for computing the distance matrix required.
I have considered that all socket types in a country are equally distributed (have the same weight) which is not true in practice. I had to do this because I do not have access to the actual spread of electrical socket types and I have also artificially added non-existent compatible socket types in different countries. However, this should be a good indication of how different countries relate to one another regarding socket configurations available.
Implementation
Include the libraries
library(rworldmap)  # This library provides choropleth maps
library(dplyr)      # For data manipulation
Load the data.csv file and apply a simple transformation. The reason for it is that some plug types are compatible between them. Suppose if a country only has type D available, it essentially means that it also accepts type C. The reverse is not always true, however.
raw <- read.csv("data.csv", stringsAsFactors = FALSE)
data <- raw %>%
  mutate(A = as.numeric(A == 1 | B == 1)) %>%
  mutate(C = as.numeric(C == 1 | D == 1)) %>%
  mutate(E = as.numeric(E == 1 | C == 1 | `F` == 1)) %>%
  mutate(`F` = as.numeric(`F` == 1 | C == 1 | E == 1)) %>%
  mutate(H = as.numeric(H == 1 | C == 1)) %>%
  mutate(J = as.numeric(J == 1 | C == 1)) %>%
  mutate(K = as.numeric(K == 1 | C == 1)) %>%
  mutate(L = as.numeric(L == 1 | C == 1)) %>%
  mutate(N = as.numeric(N == 1 | C == 1)) %>%
  mutate(O = as.numeric(O == 1 | C == 1))
Hierarchical Clustering needs a distance matrix to be created.
distance <- dist(data %>% select(-country))
Fit the model using a complete method. The different methods can output different clusters, some more balanced than the others. Choosing different methods can help detect outliers.
fit <- hclust(distance, method = "complete")
The actual clusters are separated by specifying the number of desired approaches. The clusters are then added to the dataframe.
data$cluster <- cutree(fit, k = 5)
Create a rworldmap specific dataset by joining the previous dataframe with the package's dataframe by country.
plot_data <- joinCountryData2Map(data,
                                 joinCode = "NAME",
                                 nameJoinColumn = "country",
                                 nameCountryColumn = "country",
                                 verbose = TRUE)
Use the plot_data to finally output a world map.
mapCountryData(plot_data,
nameColumnToPlot = "cluster",
catMethod = "categorical",
colourPalette = "diverging",
addLegend = FALSE,
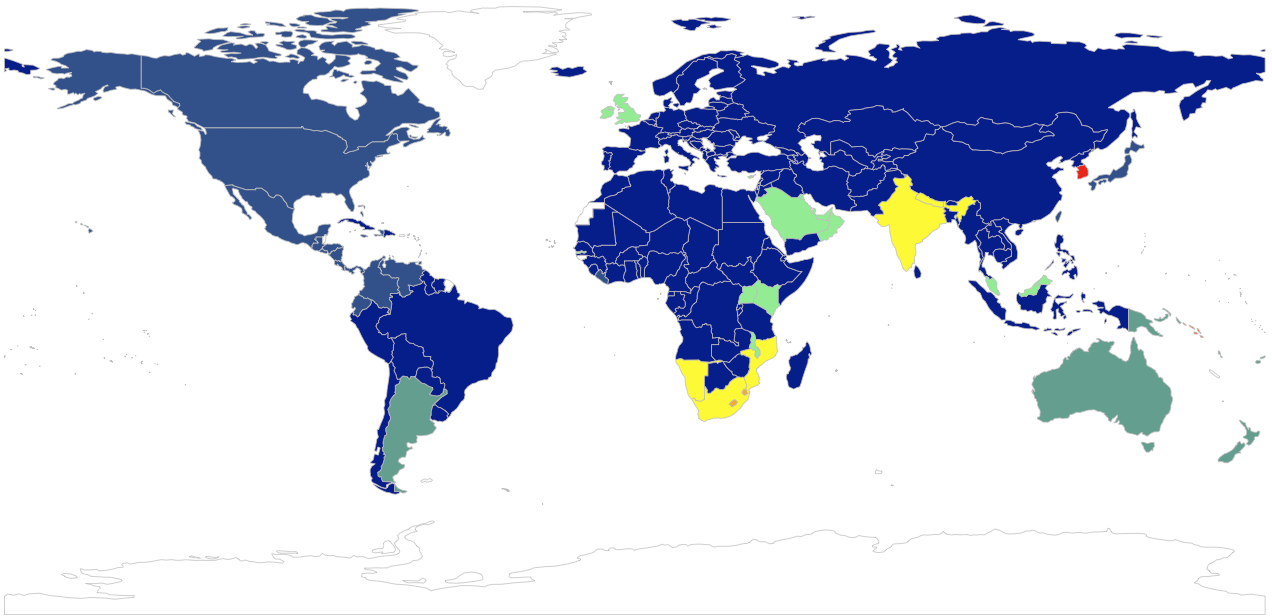
mapTitle = "Countries likely to have similar electrical plug configurations")

Conclusion
Two conclusions can be drawn from choosing different combinations of clusters and clustering methods:
- With a tiny number of clusters, like 2, there will always be a cluster made of Lesotho and Swaziland. They use plug type M, these are very specific and not widespread.
- When choosing a slightly more significant number of clusters, like 5, there will always be a large cluster made up primarily of C based plug types. This can be considered to be the most popular plug type.
- Great Britain and Ireland, although in Europe, quickly create their cluster outside continental Europe.
The full code
Here is the full code for completeness. It is very similar to the actual Shiny application available on Github.
library(rworldmap)
library(dplyr)
raw <- read.csv("data.csv", stringsAsFactors = FALSE)
data <- raw %>%
  mutate(A = as.numeric(A == 1 | B == 1)) %>%
  mutate(C = as.numeric(C == 1 | D == 1)) %>%
  mutate(E = as.numeric(E == 1 | C == 1 | `F` == 1)) %>%
  mutate(`F` = as.numeric(`F` == 1 | C == 1 | E == 1)) %>%
  mutate(H = as.numeric(H == 1 | C == 1)) %>%
  mutate(J = as.numeric(J == 1 | C == 1)) %>%
  mutate(K = as.numeric(K == 1 | C == 1)) %>%
  mutate(L = as.numeric(L == 1 | C == 1)) %>%
  mutate(N = as.numeric(N == 1 | C == 1)) %>%
  mutate(O = as.numeric(O == 1 | C == 1))
distance <- dist(data %>% select(-country))
fit <- hclust(distance, method = "complete")
data$cluster <- cutree(fit, k = 5)

plot_data <- joinCountryData2Map(data,
                                 joinCode = "NAME",
                                 nameJoinColumn = "country",
                                 nameCountryColumn = "country",
                                 verbose = TRUE)
mapCountryData(plot_data,
                    nameColumnToPlot = "cluster",
                    catMethod = "categorical",
                    colourPalette = "diverging",
                    addLegend = FALSE,
                    mapTitle = "Countries likely to have similar electrical socket configurations")